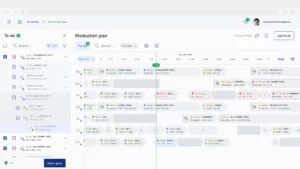
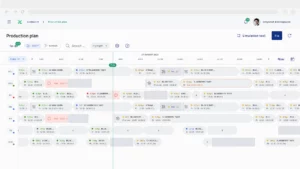
Gantt chart view

A Gantt chart view is a visual management tool that displays manufacturing tasks on a timeline. It is useful for production scheduling and production management as it allows planners to see the sequence and duration of tasks, manage dependencies and allocate resources efficiently.

Gantt chart view of the production schedule and statuses

Gantt view in production scheduling and manufacturing management

The Gantt view in Nexelem is designed to provide essential information to production planners in longer time span, helping them understand the current and future production situation quickly and effectively. Nexelem provides a clear overview of the production schedule, with Gantt charts helping to prevent delays and ensure that tasks are completed on time.

Gant chart view of the production schedule and its status

Improved Scheduling

01

Planners can easily schedule tasks, allocate resources, and manage dependencies, ensuring a smooth workflow.

Clear Timeline Visualisation

02

Gantt charts provide a visual timeline of tasks, making it easy to see the start and end dates of each activity at a glance.

Enhanced Tracking

03

The progress of tasks can be monitored in real-time, allowing planners to quickly identify delays and take corrective actions.

Reduced Human Error

04

Nexelem’s Gantt charts are designed to be clear and straightforward, avoiding the confusion of overlapping tasks and dependencies.

No Spaghetti Effect

05

Nexelem’s Gantt charts are designed to be clear and straightforward, avoiding the confusion of overlapping tasks and dependencies.

Arrange a demo